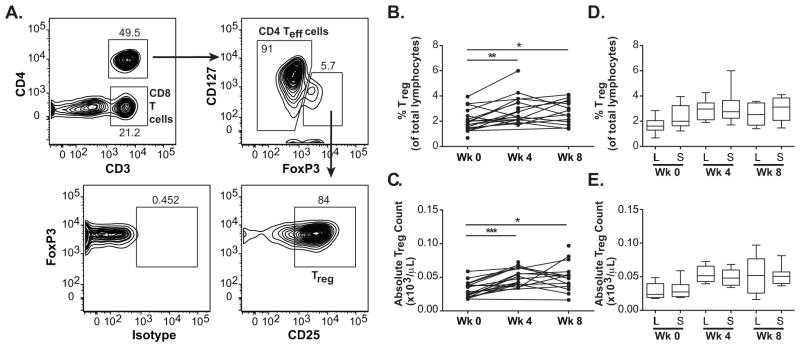
Figure 3.
Levels of circulating Treg cells with treatment. A, Gating strategy for Treg cells, CD4 Teff cells and CD8 T cells. B and C, Time course of percentage of Treg cells of total lymphocytes and absolute counts of Treg cells, respectively, for accessed patients at week 0 (pre-treatment), week 4 (cycle 1) and week 8 (cycle 2). Connected dots show time course of the same patient. D and E, Box plots of percentage of Treg cells of total lymphocytes and absolute counts of Treg cells, respectively, for long-term (L) and short-term (S) survivors at each time point. Whiskers show minimum and maximum levels. * p-value < 0.05, ** p-value < 0.01, *** p-valye < 0.001.

