
Figure 2. Human IL-7Rαlow and high effector memory CD8+ T cells have different levels of CX3CR1 gene and protein expression.
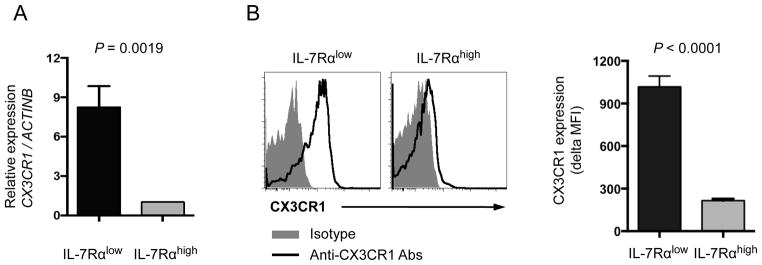
(A) RT-qPCR analysis of CX3CR1 gene expression in FACS-sorted IL-7Rαlow and high effector memory (EM) CD8+ T cells of healthy individuals (n = 5) (B–C) Flow cytometric analysis of CX3CR1 expression on IL-7Rαlow and high EM CD8+ T cells in peripheral blood of healthy people (n = 39). (B) Representative histograms of CX3CR1 and isotype control staining. (C) Mean fluorescent intensity (MFI) of CX3CR1 expression by IL-7Rαlow and high EM CD8+ T cells. Delta MFI of CX3CR1 expression was obtained by subtracting MFI of isotype control staining from MFI of CX3CR1 staining. Bars and error bars indicate mean and standard error of the mean (SEM), respectively.