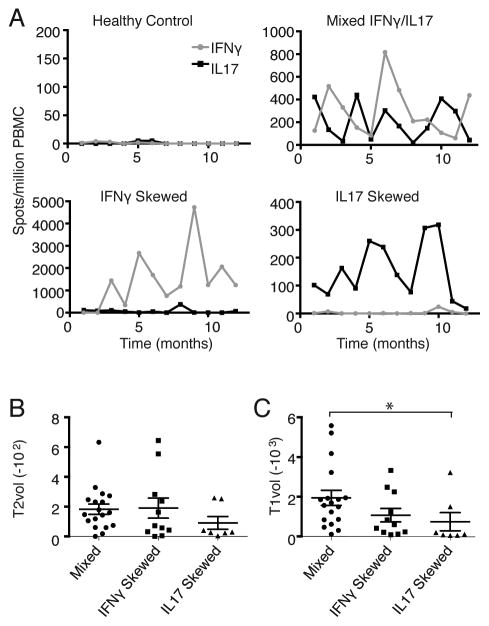
FIGURE 6.
MS patients have diverse myelin-specific cytokine profiles. (A–C) PBMC were collected from relapsing MS patients with moderate disability on a monthly basis over the course of 1 year. (A) ELISPOT assays were performed to assess the frequency of MBP-specific IFNγ and IL-17 producers. Representative examples are shown. Patients were classified into three groups: IFNγ predominant (n=11), IL-17 predominant (n=7) and IFNγ/IL-17 mixed (n=18), based on criteria described in the Materials and Methods section. (B, C) Each subject underwent cerebral MRI scanning. T1- and T2-weighted lesion volume and brain parenchymal volume (BPV) were measured using a semi-automated approach [17]. The figures show average T1 and T2 lesion volumes normalized to total BPV. (*p=0.02; non-parametric, one-way ANOVA with Dunn’s multiple comparisons test)

