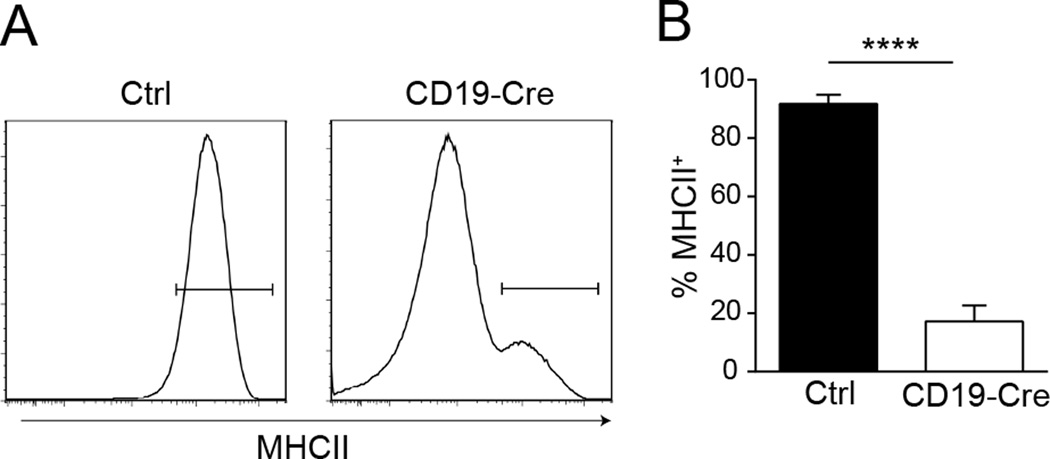
Figure 1. Deletion of MHCII in B cells.
(A) Representative histograms of MHCII staining of splenic B cells from control, MHCIIfl/fl, and CD19-Cre MHCIIfl/fl mice. Cells were first gated as EMA− TCRβ−, then CD19HiCD138−.
(B) Frequency of MHCII+ splenic B cells, as identified as in (A), in the experimental cohorts. Data are pooled from 6 independent cohorts of 12 week old mice; control n=30 and CD19-Cre n=32. Data are represented as mean +/− SEM. Statistics were calculated by two-tailed Mann-Whitney test. ****p < 0.0001.

