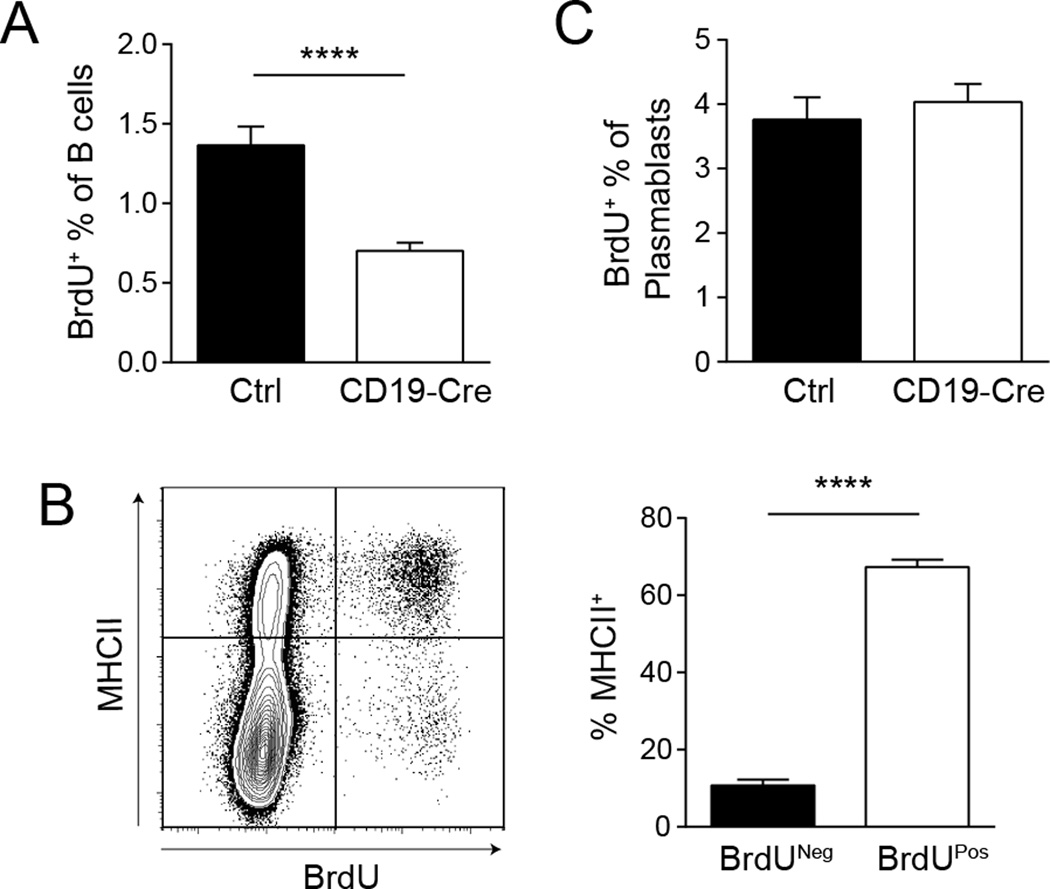
Figure 3. MHCII+ B cells have a significant proliferation advantage.
One hour before sacrifice, mice were injected with 1mg of BrdU i.p. (A) Splenic B cells (EMA− TCRβ−CD22+) were evaluated for BrdU incorporation by flow cytometry. Data are represented as mean +/− SEM. (B) Representative staining plot of MHCII expression and BrdU incorporation of B cells from a CD19-Cre mouse. The bar graph represents the percent of MHCII+ B cells within the BrdU− and BrdU+ B cell populations as the mean +/− SEM. (C) Plasmablasts (EMA− TCRβ−CD22IntCD138+) were evaluated for BrdU incorporation by flow cytometry. Data are represented as mean +/− SEM. Data are pooled from 2 independent experiments; control n=21, CD19-Cre n=20. Statistics were calculated by two-tailed Mann-Whitney test. ****p < 0.0001.

