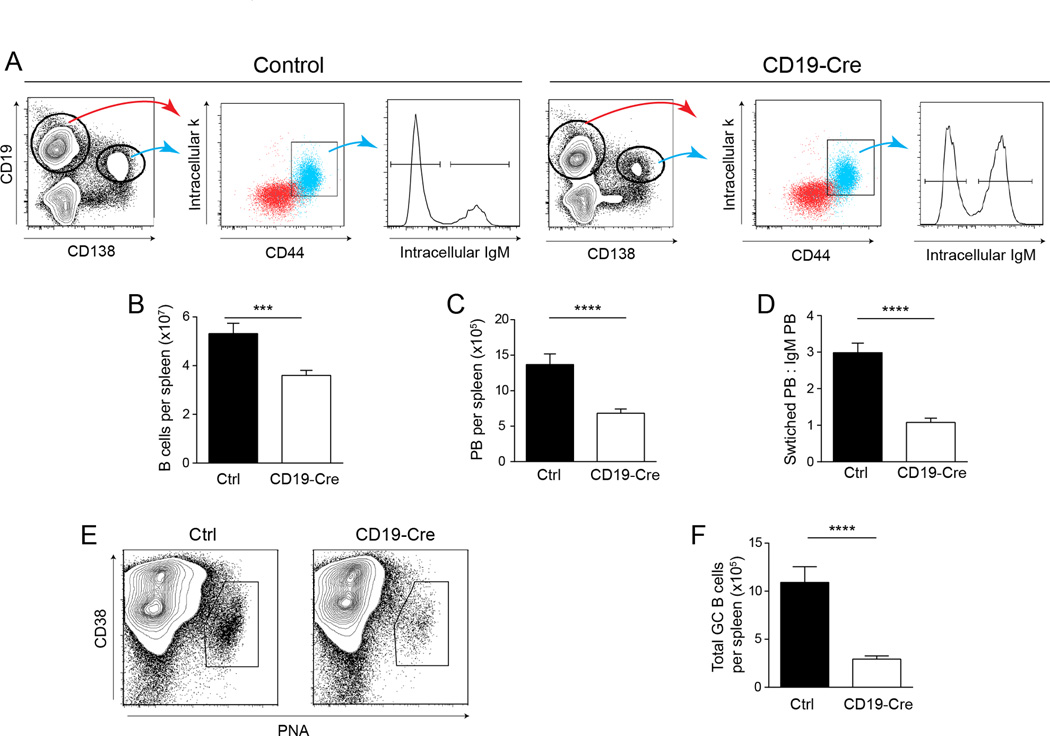
Figure 4. Expression of MHCII is critical for plasmablast and GC B cell differentiation.
(A) Representative staining plots of plasmablast and B cell gating. Cells were first gated as EMA− TCRβ−. (B) Total number of B cells and (C) plasmablasts per spleen determined by flow cytometry. Data are represented as mean +/− SEM. (D) Isotype switched plasmablasts (IgM−) were normalized to the non-switched (IgM+). Data are represented as mean +/− SEM. Data are pooled from 6 independent cohorts of 12 week old mice; control n=30 and CD19-Cre n=32. (E) Representative staining plots of GC B cell gating from one control mouse and one CD19-Cre mouse. Cells were first gated on EMA− TCRβ−CD22+. (F) Total number of GC B cells per spleen identified as in (E). Data are represented as mean +/− SEM. Data are pooled from 2 independent cohorts of 12 week old mice; control n=26 and CD19-Cre n=16. Statistics were calculated by two-tailed Mann-Whitney test. **p < 0.01; ***p < 0.001; ****p < 0.0001.

