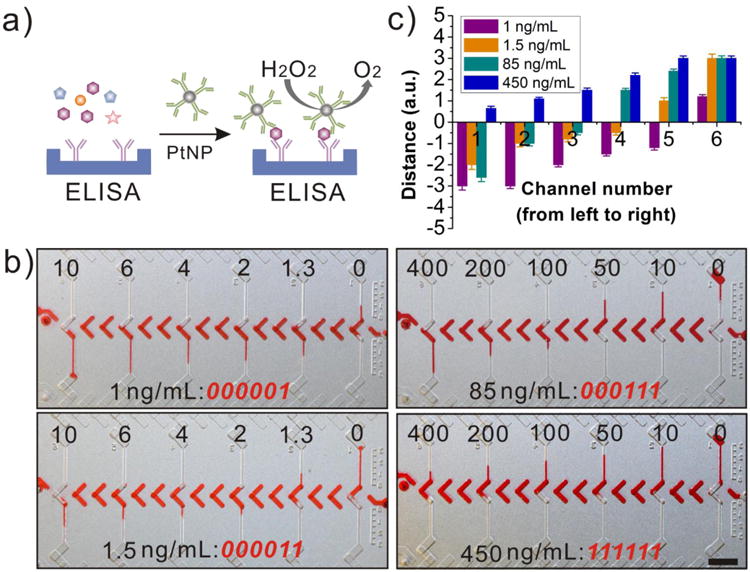
Figure 3.

CEA assay on the DV-chip. (a) Schematic diagram of oxygen generation from the sandwiched ELISA. (b) Bar charts and corresponding digital readouts (red font) for CEA samples with indicated concentrations (lower labels). The concentrations of control CEA samples are indicated by upper labels. (c) Quantitation of bar-chart lengths for samples shown in (b). Distances travelled by ink bars exceeding the channel length were designated ‘3’. Values are the mean and standard deviation (SD) of three independent experiments. a.u., arbitrary units. Scale bar, 0.5 cm for (b).
