
Figure 4.
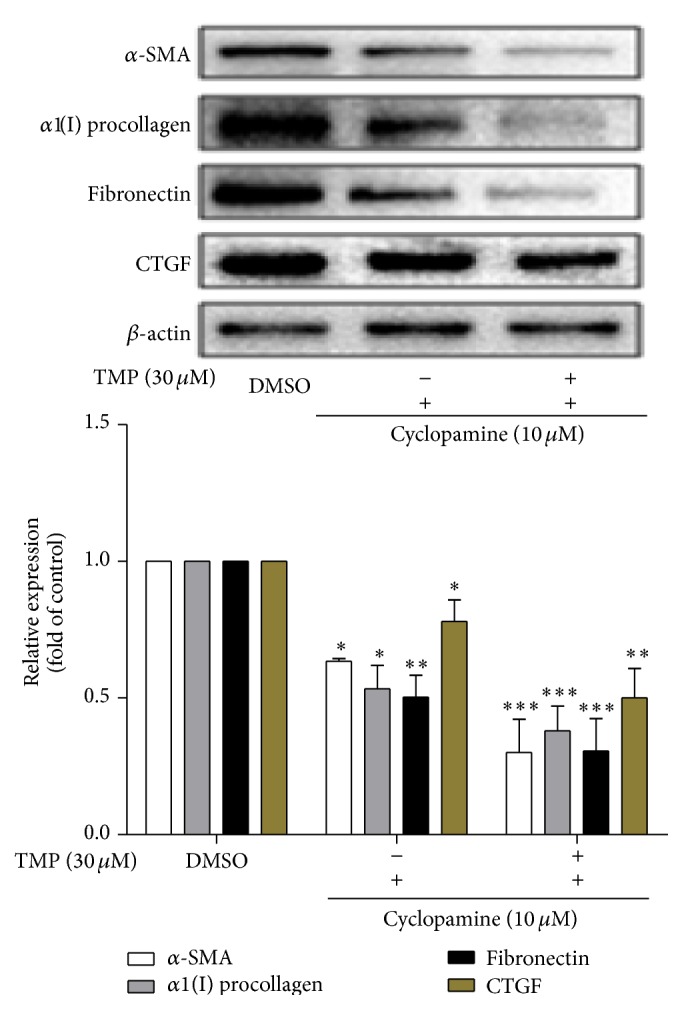
The effects of TMP on the levels of α-SMA, α1(I) collagen, fibronectin, and CTGF proteins expressed in HSC-T6 cells. Data were reported as means ± SD. For statistical analysis, ∗ p < 0.05, ∗∗ p < 0.01, and ∗∗ p < 0.001 represent significant difference.