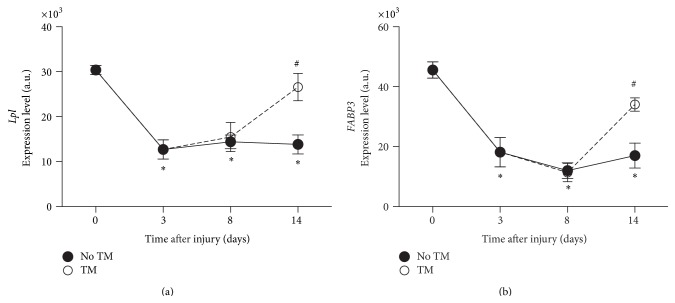
Figure 5.
Fatty acids metabolism. Gene expression level changes in Lpl (a), Fabp3 (b), in soleus of trained and untrained SCI animals. All expression levels are referenced to a control sample's GAPDH levels. ∗Significantly different from controls (p < 0.05). #Significantly different from untrained animals (p < 0.05).

