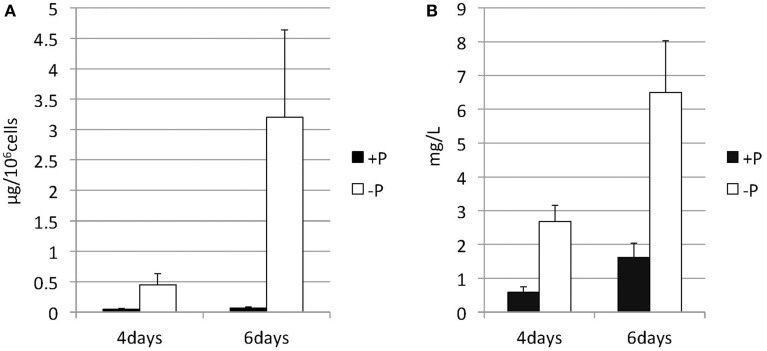
Figure 2.
Changes in the TAG content of Nannochloropsis in response to P starvation. Cells cultured to a logarithmic phase under standard conditions were then inoculated into standard (+P) or -P medium and cultured for 4 or 6 days. The y-axis is (A) Total TAG per 106 cells or (B) total TAG per liter of culture. Values represent the mean from three independent experiments ± SD.

