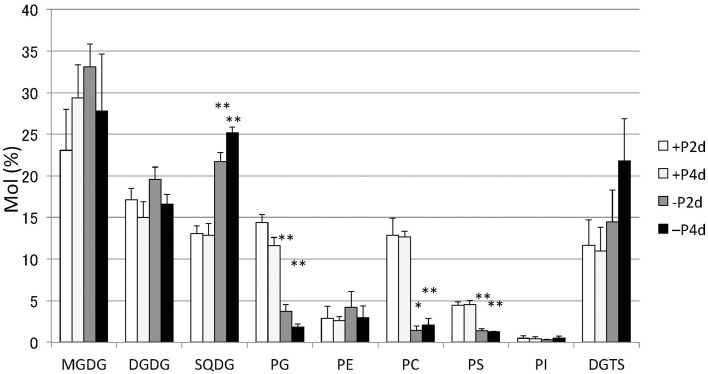
Figure 3.
Changes in major lipid classes in P-starved cells. Cells cultured to a logarithmic phase under standard conditions were then inoculated into standard (+P) or -P medium and cultured for 2 days (2 d) or 4 days (4 d). Lipid levels were determined by GC. Values represent the mean from three independent experiments ± SD. Asterisks indicate a statistically significant difference compared with the empty vector control based on a two-tailed Student's t-test (*P < 0.05 and **P < 0.01).

