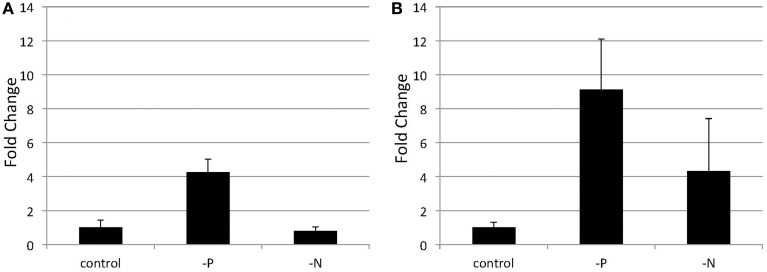
Figure 5.
Quantitative real-time PCR showing the induction of SQD2 gene expression in Nannochloropsis after P or N starvation. Logarithmic-phase cells were transferred to standard (control), -P and -N media and cultured for 4 days (A) or 6 days (B). The values are normalized to the expression of TUB and the SQD2/TUB ratio under standard conditions was set as 1. Values represent the mean ± SD from three independent replicates.

