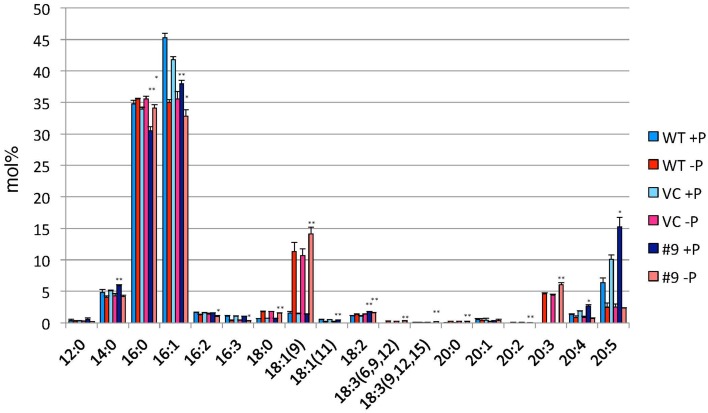
Figure 9.
Analysis of the fatty acid composition of the TAG fraction in pCrSQD2-CrDGTT4 (#9), the vector control (VC) and wild-type (WT) lines. Cells were cultured in control (+P) or -P medium for 4 days. Values are the mean ± SD from three independent experiments. Asterisks indicate a statistically significant difference compared with VC based on a two-tailed Student's t-test (*P < 0.05 and **P < 0.01).

