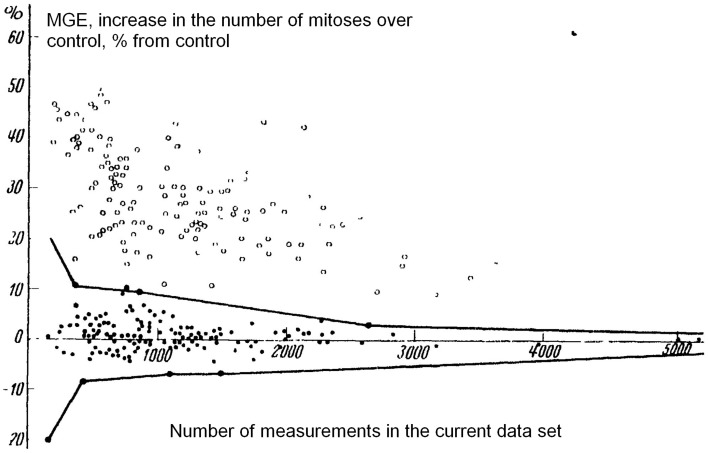
Figure 1.
Graphical summary of all results on MGE by Gurwitsch et al. in 1923–1929 (both inductor and recipient—onion roots, from Schwemmle, 1929). Each point represents a set of data. Horizontal axis, number of mitoses counted in the work; vertical axis, increase over control, %. Black dots, controls (no MGE); circles, experiments (regarded as positive MGE). Black line, limit lines for control (lines including the whole control distribution. Do not mix them with standard error or standard deviation). All circles (i.e., experiments with positive MGE) are outside the limit lines of the control distribution.

