Figure 6.
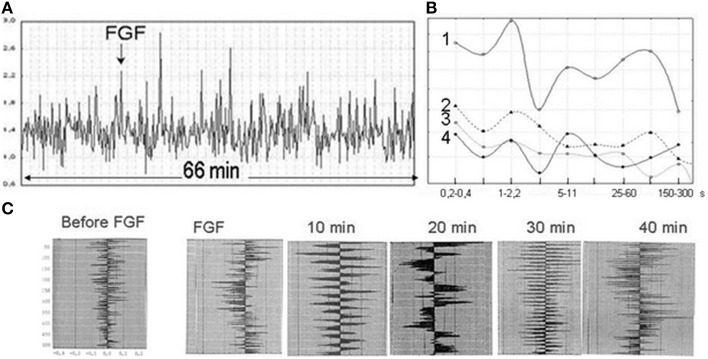
UPE of a fibroblast culture (monolayer) after addition of a mitogenic agent (fibroblast growth factor FGF-1, 0.05 mg/ml). From Beloussov (2006). (A) UPE “fast dynamics” (FGF addition marked with the arrow). Horizontal axis, time, min; Vertical axis, intensity of UPE per 0.1 s. (B) Fourier spectra of UPE. Horizontal axis, period of the Fourier band (sec). Vertical axis, spectral density (log scale). Each plot is the average of five spectra (from independent measurements). (1) FGF-affected fibroblast culture; (2) intact cardyomyocyte culture; (3) cell-free medium; (4) intact fibroblast culture. Note similarity of the shape of (1) and (4), while spectral density of (1) is greatly enhanced. (C) A series of autocorellograms of Fourier spectra covering successive 10 min periods: before FGF-1 administration and 0–40 min after it. Note extensive temporal dynamics of photon emission.

