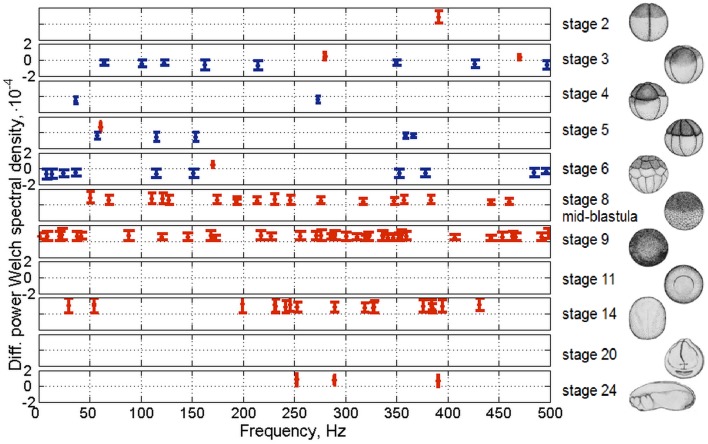
Figure 7.
Statistical Fourier spectra of UPE of single frog embryos (Xenopus laevis). From Beloussov and Volodyaev (2013). Rows, different stages of development. Horizontal axes, frequency of the Fourier band (Hz); vertical axes, difference between mean spectral band of UPE and mean spectral band of the background noise (UPE from cuvette with medium). Shown only Fourier bands of UPE from embryos, significantly different from the background (P < 0.001). Whiskers, 99.9% confident intervals. Whiskers above zero (red)—Fourier band in UPE higher than in background, whiskers below zero (blue)—Fourier band in UPE lower than in background (do not mix with intensity of UPE). Stage numbers and morphology shown on the right. Stage 8, mid-blastula (known for abrupt activation of the embryo genome).

