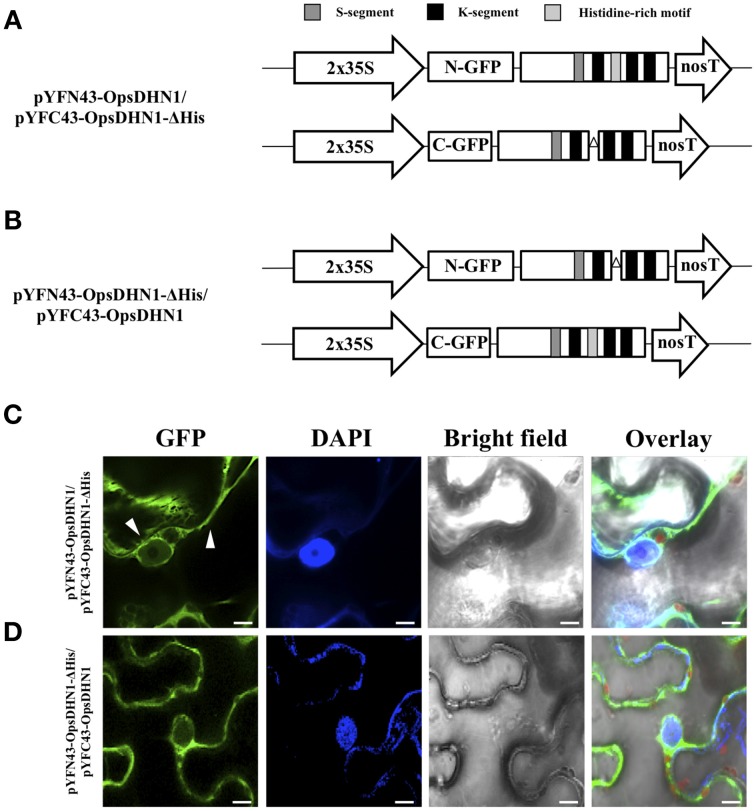
Figure 4.
Visualization of OpsDHN1/OpsDHN1-ΔHis dimer formation using BiFC approach. (A,B) Schematic representation of OpsDHN1 derived versions cloned into pYFN43 and pYFC43 vectors. (C,D) BiFC analysis of OpsDHN1/OpsDHN1-ΔHis and swapped constructs. White arrowheads indicate cytosolic and nuclear compartments. The fluorescence was assessed by laser-scanning confocal microscopy. From left to right: the GFP and DAPI fluorescence spectrum, bright field, chlorophyll fluorescence and overlay signals. The S-segment, K-segments, and histidine-rich motif are depicted as dark-gray, black, and light-gray boxes, respectively. The deleted histidine-rich motif is represented by open triangle. The scale bar corresponds to 10 μm.

