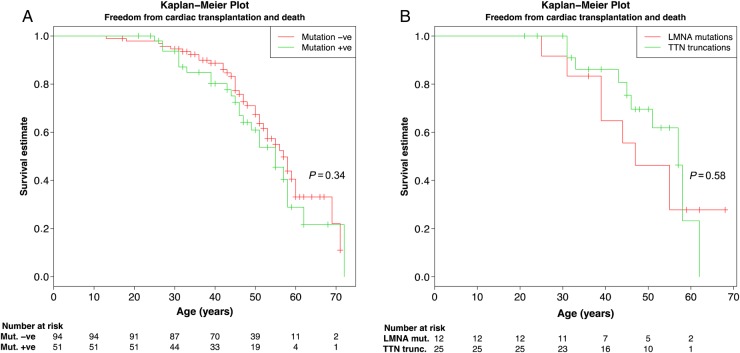
Figure 4.
Kaplan–Meier curve demonstrating freedom from composite endpoint (cardiac transplantation and death from cardiac causes). Panel A shows Kaplan–Meier curve for patients with and without detected disease-causing mutation and Panel B shows comparison between patients with TTN vs. LMNA mutations. Importantly, many patients are 40–60 years old at a moment and have not reached any endpoint. Hatch marks indicate patient age at last follow-up date in Finnish dilated cardiomyopathy study.

