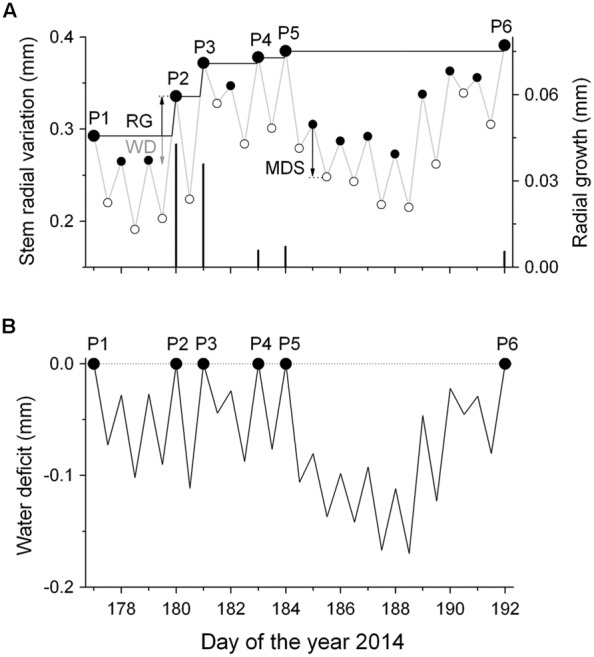
FIGURE 1.

Scheme of detrending dendrometer records (DMR) for growth. (A) Time series of daily maximum and minimum DMR (gray line) and fitted ‘growth line’ (black line) (RG, radial growth; MDS, maximum daily shrinkage; WD, water deficit). The symbols P1–P6 indicate successively increasing daily maximum DMR, whereby the difference among successive values is regarded as RG (black bars). MDS is the diurnal amplitude between the morning maximum and the daily minimum (filled and open circles, respectively). (B) The extracted daily stem water deficits (ΔW) as the difference between the ‘growth line’ and the daily maximum and minimum DMR (small closed and open circles, respectively). Missing stem radius recovery indicates a continuous ΔW.
