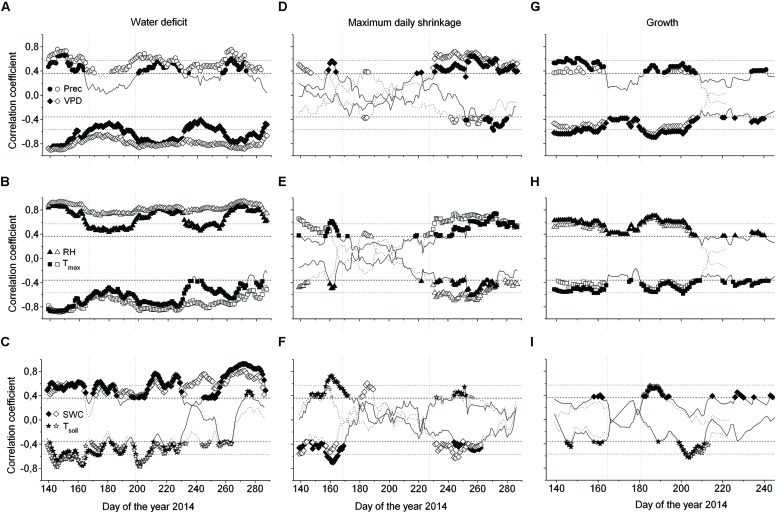
FIGURE 7.
Moving correlations (window 30 days) between the water deficit (ΔW) (A–C), MDS (D–F) and growth (G–I), and environmental variables of saplings (open symbols) and mature Picea abies (filled symbols). Spearman rank-correlations (ρ) were calculated for relationships between (i) precipitation and ΔW, MDS, and growth, and (ii) all environmental variables and growth. For all other relationships the Pearson product-moment coefficients (r) are shown (Prec, daily precipitation sum; VPD, vapor pressure deficit; RH, relative air humidity; Tmax, daily maximum air temperature; SWC, soil water content; Tsoil, mean soil temperature). A lag of 1 day was considered in the relationship between ΔW, MDS, and growth, and SWC and Tsoil. Horizontal dotted and dashed lines indicate P = 0.001 and P = 0.05 significance levels, respectively.

