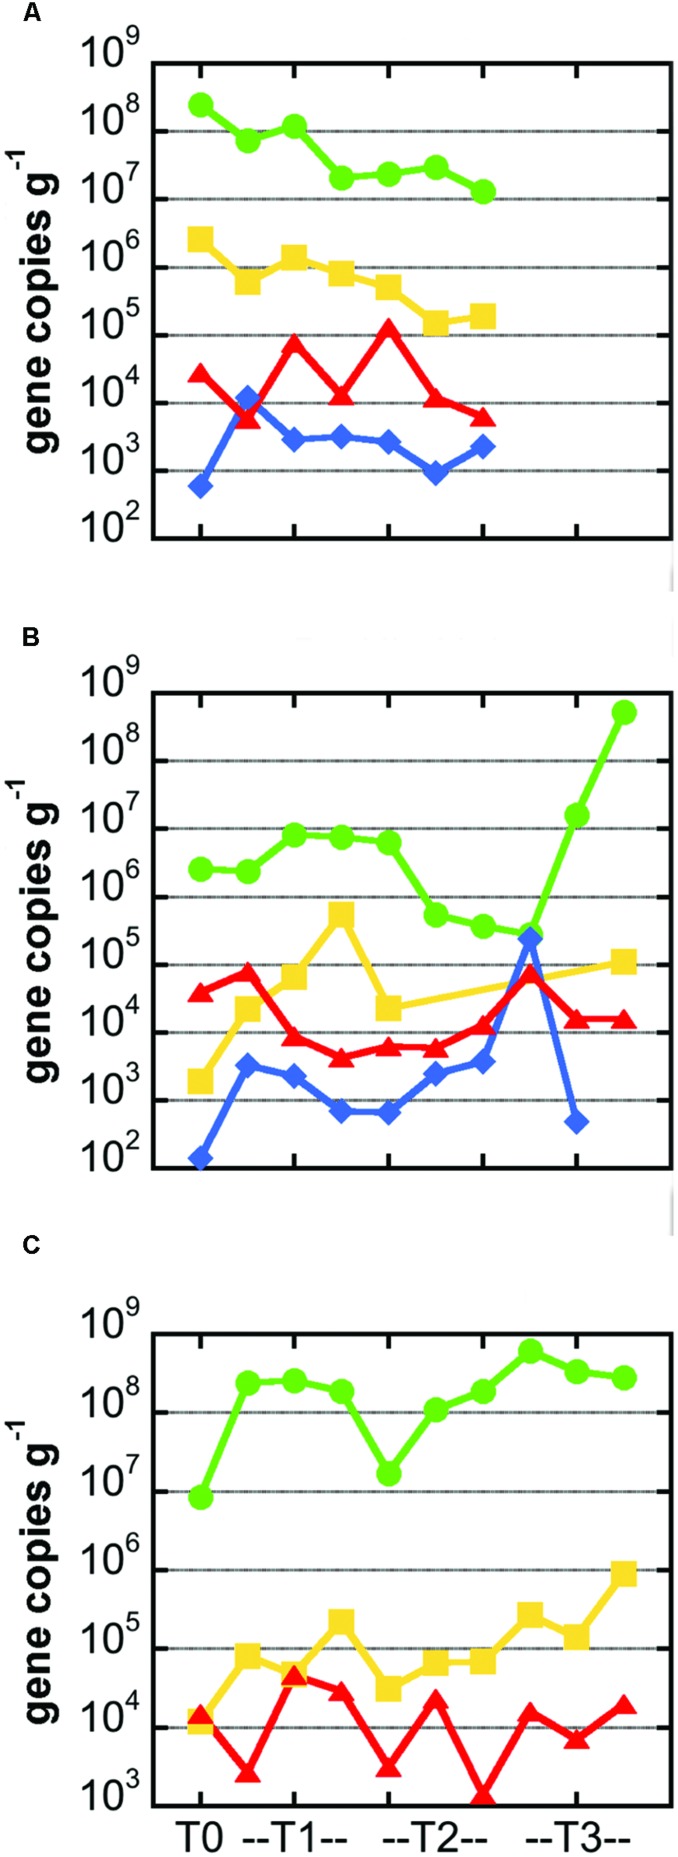
FIGURE 4.
Abundance of carbon cycling functional genes in microbial communities hosted in basalts samples from the Marker 2 (A), Ula Nui (B), and JdF2009 (C) sample sets. In all panels, gene abundance for each sample is presented as number of gene copies per gram of rock. Green circles: bacterial 16S rRNA gene; yellow squares: RuBisCO form II gene cbbM from Calvin Benton Bassham pathway; red triangles, methyl coenzyme M reductase gene mcrA from methane cycling pathways; blue diamonds, ATP citrate lyase gene aclB from reverse TCA process. Note missing symbols in (A) indicate samples that were not available for analysis, while missing symbols in (B,C) indicate values that were not above the limit of detection (∼103 gene copies per gram for cbbM and ∼102 gene copies per gram for aclB). Lines connecting symbols are for esthetic purpose and convey no meaning.

