
FIGURE 2.
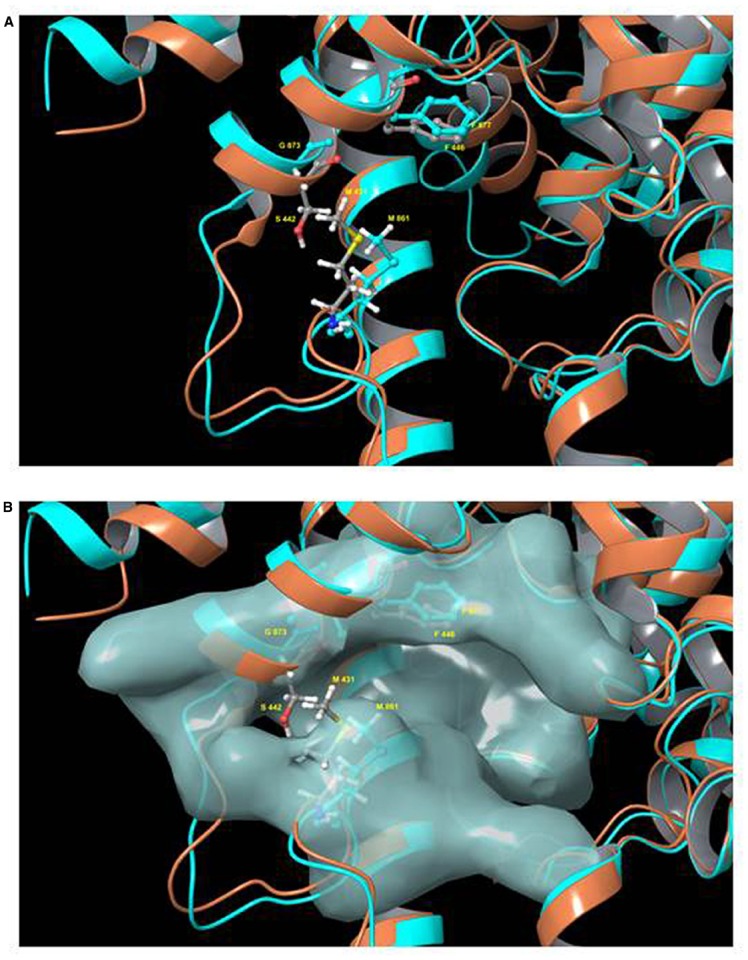
Model of the binding pocket of TbrPDEB1 and hPDE4. Model of the superimposed binding pockets of TbrPDEB1 (turquoise ribbons and carbon atoms) and hPDE4B (orange ribbons, gray carbon atoms). The figure depicts chain A from the published 4I15 PDEB1 structure and chain B of hPDEB structure 1XM4 (alignment RMSD 1.847 Angstrom). (A) Ribbon model of the cAMP binding pocket. (B) Same view but with the molecular surface for TbrPDEB1 residues shown. Side chains for the conserved hydrophobic clamp phenylalanine residue in TbrPDEB1 (Phe877, turquoise) and hPDE4B (Phe446, gray carbons) are shown to illustrate the orientation of the P pocket relative to this canonical binding site feature. Side chains for the pair of amino acid residues at the entrance to the P pocket in TbrPDEB1 and hPDE4B are also shown—Met861 and Gly873 in TbrPDEB1 (turquoise), and Met431 and Ser442 in hPDE4B (colored by element—carbon gray, hydrogen white, nitrogen blue, oxygen red, sulfur yellow). For TbrPDEB1 the P-pocket is clearly visible in Frame B, directly adjacent to the main ligand binding site and delineated by M861 and G873, where in hPDE4B this space is filled entirely by M431 and S442. The models were constructed by Dr. R. K. Campbell of the Marine Biology Laboratory, Woods Hole, MA, USA, using Maestro software release 2015-2 (Schrödinger, Portland, OR, USA).