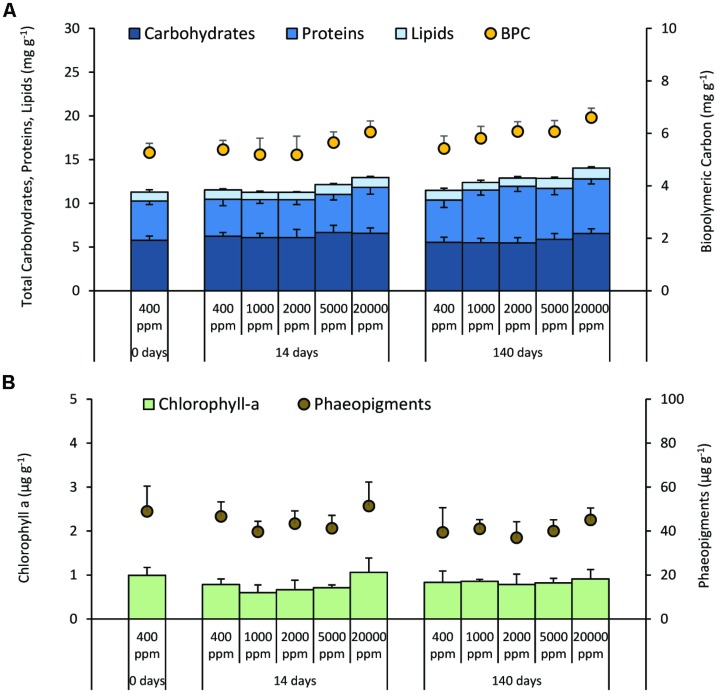
FIGURE 1.
Quantity and quality of the sediment organic matter. Reported are the mean values and relative SDs for (A) Carbohydrate, protein, and lipid content in surface sediments, as well as the sediment concentration of the Biopolymeric Carbon (BPC), and (B) chlorophyll-a and phaeopigment concentration under different high-CO2 experimental systems (1,000–20,000 ppm) and in the controls (i.e., 400 ppm).

