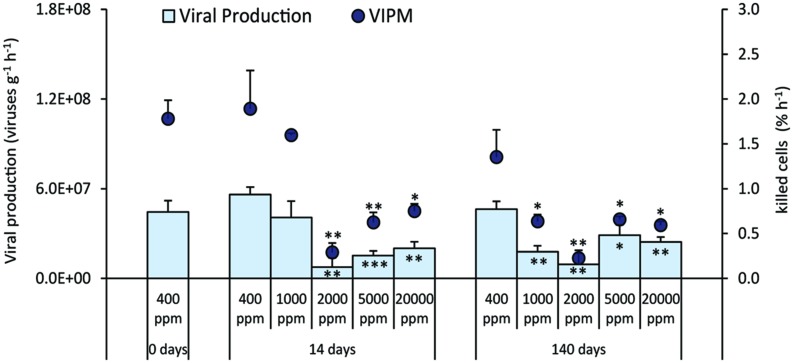
FIGURE 5.
Rates of viral production and virus-induced prokaryotic mortality (VIPM) in the different high-CO2 experimental systems (1,000–20,000 ppm) and in the controls (i.e., 400 ppm), showing mean and relative SDs values. Significant differences between treatments and controls are indicated with asterisks: *p < 0.05, **p < 0.01, and ***p < 0.001.

