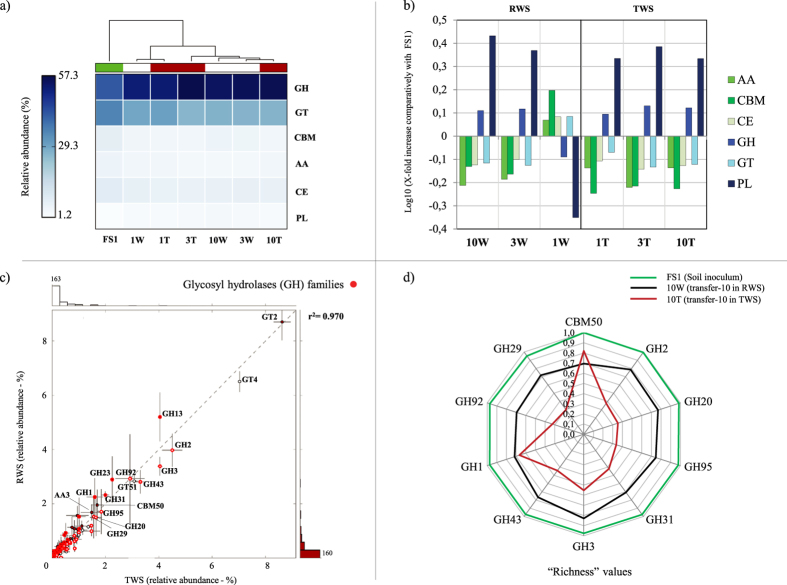
Figure 3. Carbohydrate-active functional profiles.
(a) Heat map of the relative abundance (%) of each CAZy class (AA, CBM, CE, GH, GT and PL) in each metagenome; (b) Log10 X-fold increase of each CAZy class in RWS and TWS samples comparatively to the soil inoculum (FS1); (c) Pairwise comparison between RWS (1W, 3W and 10W) and TWS (1T, 3T and 10T) samples, red dots: are functions belonging to glycosyl hydrolases (GH) families; (d) “Richness” values (number of clusters at 97% nucleotide identity over the total retrieved reads in each family) of the most enriched CAZy families at transfer-10 (10W and 10T) and comparison with the soil inoculum (FS1).

