
Fig. 6.
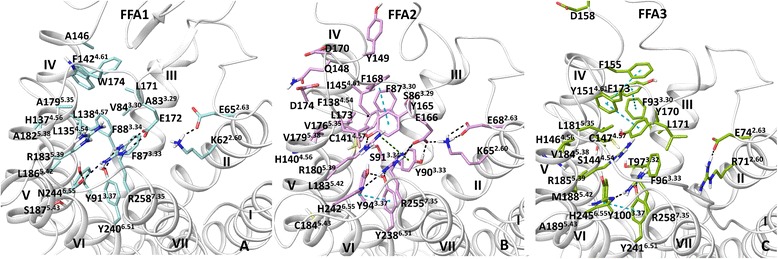
The ligand binding site of the free fatty acid 1–3 receptors a: the binding site in the FFA1 crystal structure; b and c: the binding site in the FFA1-based homology model of FFA2 and FFA3, respectively. The side chain of the binding site residues in FFAs is shown in blue, pink and green, respectively. H-bonding, π- π and π-cation interactions are shown in black, blue and green dotted lines, respectively