
Fig. 7.
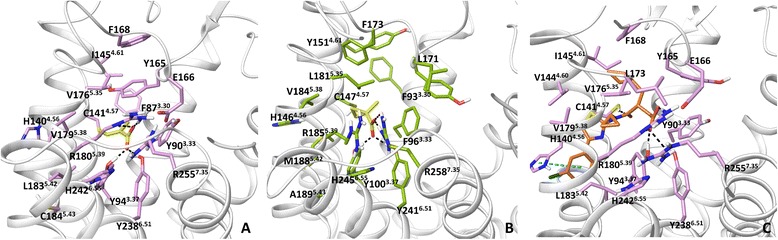
Ligand binding in FFA2 and FFA3. a: the binding mode of tiglic acid at FFA2. b: the binding mode of 1-MCPC in FFA3. c: the binding mode of 1 in FFA2. FFA2-3 homology models are based on the FFA1 crystal structure. H-bonding and π- π interactions are shown in black and blue dotted lines, respectively