
Fig. 2.
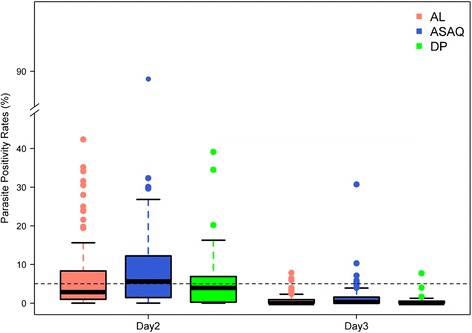
Parasite positivity rates (PPRs) on days 2 and 3 following treatment administration. Boxplot showing PPRs for each of the ACTs separately. Only studies with sample size >25 patients were considered for the plot. There were two study sites with day 3 PPR >10 %, both of these sites used the non-fixed presentations of AS-AQ. ACT, artemisinin-based combination therapy; AL, artemether-lumefantrine; AS-AQ, artesunate-amodiaquine; DP, dihydroartemisinin-piperaquine; PPR, parasite positivity rate