
Figure 2.
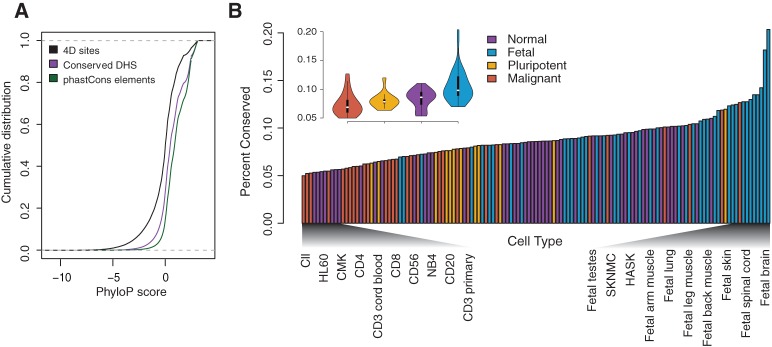
Patterns of conservation vary across cell types. (A) Cumulative distribution of single-base phyloP scores are shown for fourfold degenerate sites, conserved DHSs, and phastCons elements. The dotted gray line indicates a cumulative distribution of zero or one. (B) The proportion of conserved DHSs in each of the 130 cell types, ordered in increasing amounts of conservation. Colors denote four cell type categories: normal (purple), fetal (blue), pluripotent (yellow), or malignant (red). (Inset) Violin plot shows the distribution of the proportion of conserved DHSs for each cell type category. Cell type names at each end of the spectrum are shown for comparison.