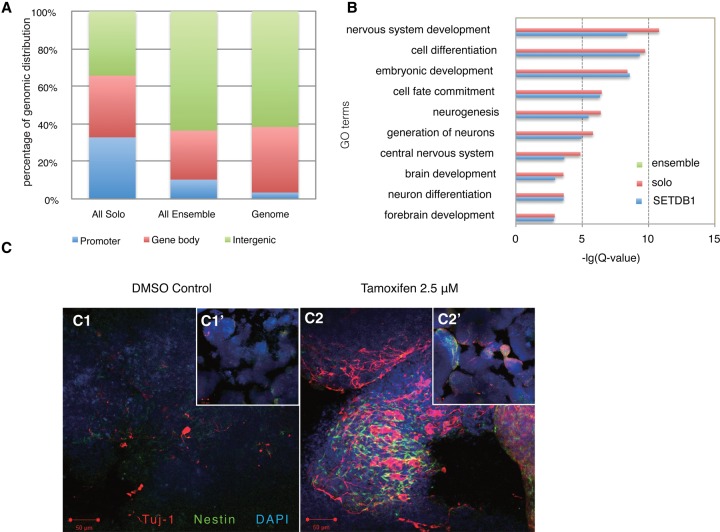
Figure 2.
SETDB1 solo and ensemble peaks display distinct biological functions. (A) Genomic distribution of SETDB1 solo and ensemble peaks. We defined regions from 2 kb upstream of the TSS to 2 kb downstream from the TSS as promoters (blue bars), from 2 kb downstream from the TSS to the transcription termination sites (TTS) as gene bodies (red bars), and all other genomic regions as intergenic regions (green bars). (B) GO analysis on all SETDB1 target genes (blue bars), SETDB1 solo target genes (red bars), and SETDB1 ensemble target genes (green bars). Fisher's exact test and Benjamini correction were performed. (C) Setdb1 was deleted in iKO mouse ES cells by Tam treatment, and ES cells were induced for neural differentiation in suspension cultures for 8 d. Immunostaining for TUJ1 (red) was used to assess neuronal cell formation. Cultures were costained with Nestin (green) and DAPI (blue). Note that more neural differentiation, as manifested by TUJ1-positive cells, was seen in Setdb1-deleted iKO cells compared with the DMSO control. (Insets) Small-magnitude images for a complete view of the embryoid bodies (EBs). Bars, 50 μm. (Insets) Bars, 100 μm.

