Figure 3.
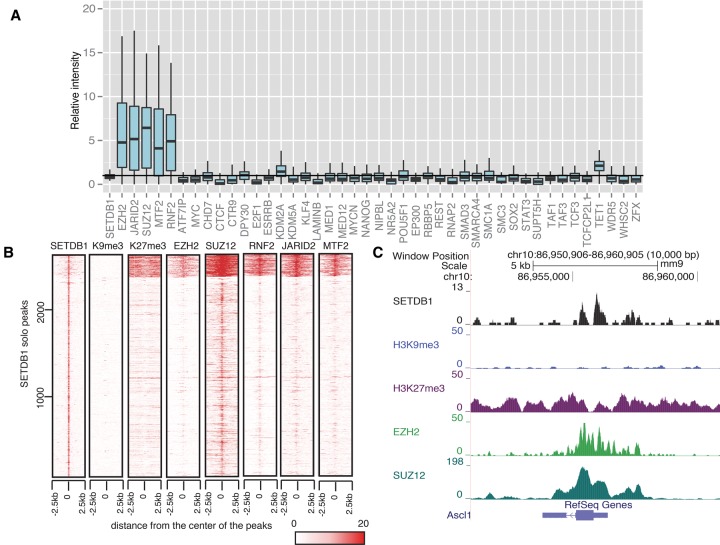
SETDB1 solo peaks overlap with PRC complex. (A) Relative binding intensity of 43 TFs at all neural development–related SETDB1 solo peak loci. All 43 TFs have public ChIP-seq data in mouse ES cells (Supplemental Table S1). The value of base pair count/peak length for all neural development–related solo peaks was further divided by the corresponding average level of all SETDB1 peaks for each TF. These ratios were used to depict the deviation from the average binding intensity across all SETDB1 peaks, which was marked with the horizontal line. (B) In the panel, 2689 SETDB1 solo peak loci were clustered to two groups by k-means according to binding intensities of SETDB1, H3K9me3 (biological replicate 1), H3K27me3 (biological replicate 1), EZH2, SUZ12, RNF2, JARID2, and MTF2. In the clustering, each line represents a genomic location around a SETDB1 binding site (±2.5 kb). The color scale indicates normalized ChIP-seq enrichment level from bigWig files generated by MACS2. (C) An example of SETDB1 solo/PRC2 peak locus (around Ascl1 promoter). SETDB1 (black track) (Yuan et al. 2009), H3K9me3 (blue track; biological replicate 1), H3K27me3 (purple track; biological replicate 1), EZH2 (light green track) (Peng et al. 2009), and SUZ12 (dark green track) (Peng et al. 2009) ChIP-seq profiles.

