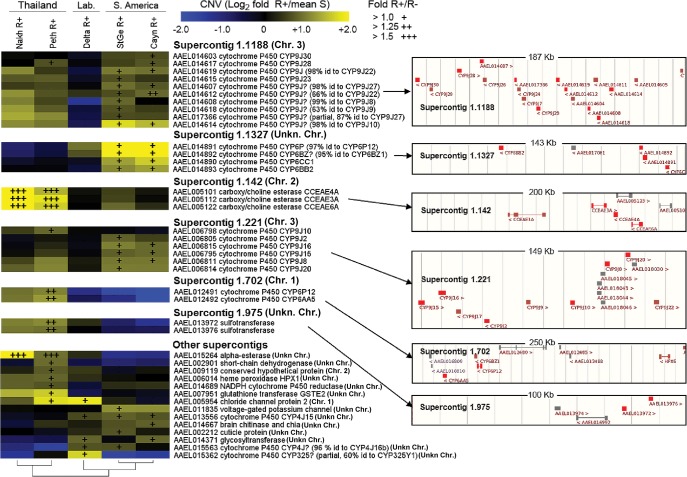
Figure 2.
Gene amplifications associated with deltamethrin resistance. (Left) CNV profiles of genes affected by gene amplifications associated with deltamethrin resistance. Color scale shows (R+)/(meanS) CNV for each resistant population, and overimposed “+” marks show (R+)/(R−) CNV. (Right) Location of gene amplifications on genomic supercontigs. Amplified genes are shown in red. Nonamplified genes are shown in maroon. Genes not included in the capture design are shown in gray. Chromosomal locations are shown as described in Timoshevskiy et al. (2014) and Juneja et al. (2014).

