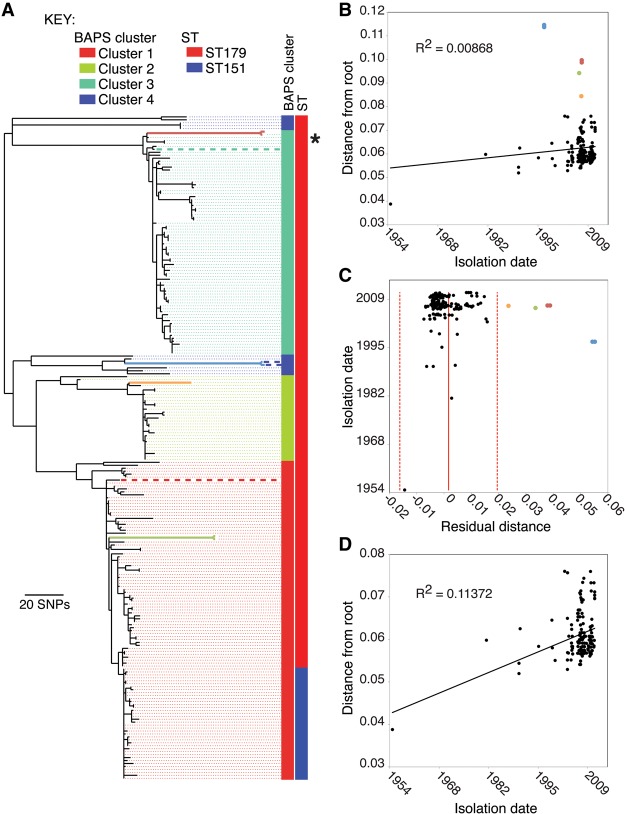
Figure 1.
Phylogenetic reconstruction and assessment of temporal signal. (A) Maximum-likelihood phylogeny of S. equi based on core genome SNPs. Clusters are colored as reconstructed by BAPS. Columns adjacent to the tree represent the BAPS cluster and MLST type associated with the strains. Dashed lines linking branches to these columns are for ease of viewing and are colored with the appropriate BAPS cluster color. Branch colors represent branches corresponding to isolates from horses JKS628 (red), JKS731 (orange), JKS121 (green), and two Pinnacle vaccine strains (blue). Thick dashed lines indicate vaccine strains: (blue) Pinnacle IN; (green) Equilis Strep E; and (red) Se1866, the basis of the Strangvac vaccine. Note that the dashed blue lines for the Pinnacle IN vaccine isolates are short relative to the long branches for these isolates, which are highlighted in blue by virtue of their raised substitution rates. The position of the reference isolate, Se4047, is indicated by an asterisk. (B) Root-to-tip plot of all isolates in the ML tree in A. (C) Residual plot of root-to-tip plot in B. Solid red line indicates the mean, and dashed red lines indicate two standard deviations from the mean. (D) Root-to-tip plot with the isolates falling outside of the 95% confidence intervals in B excluded. Colored points in B and C correspond to the isolates on colored branches in A.

