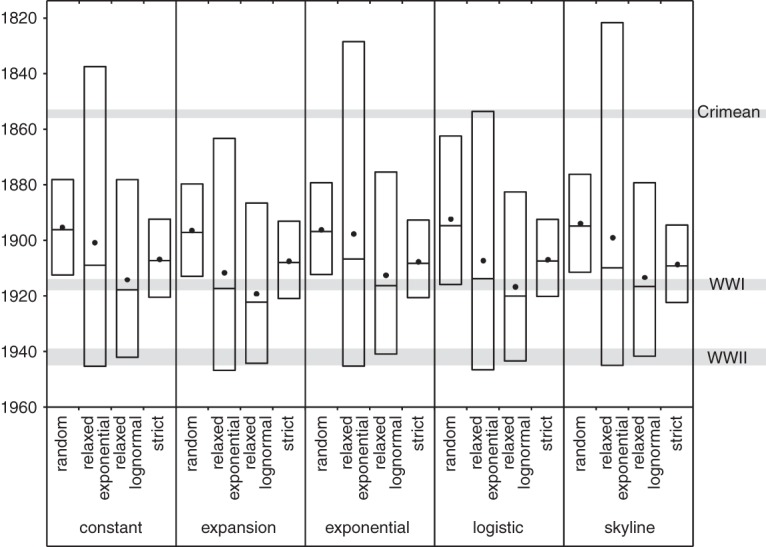
Figure 3.

Box plots showing mean (dots), median (center horizontal line), and 95% HPD (highest posterior density) for the time to the most recent common ancestor (tMRCA) of all isolates in the study under various combinations of clock and population model in BEAST. The dates of the Crimean War, World War I (WWI), and World War II (WWII) are indicated by the gray shaded regions.
