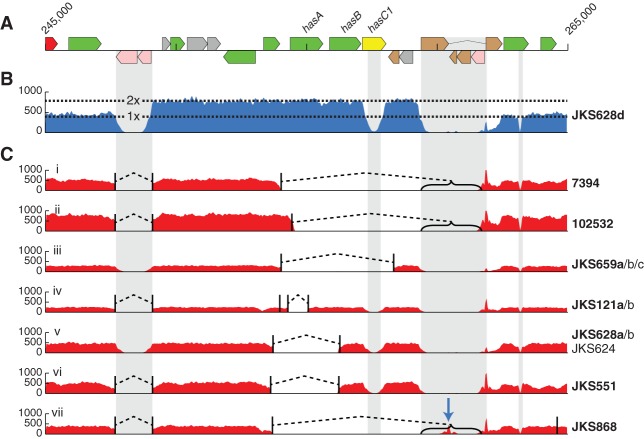
Figure 4.
Convergent deletion and amplification of the has locus in isolates recovered from independent persistently infected horses. (A) A representation of the genome annotation around the has locus. (B) Eight isolates, all from different horses, independently exhibited duplications of the region between IS repeats (indicated by gray columns). This plot represents mapped sequence read coverage of JKS628d, showing an increase in coverage spanning the has operon, representing duplication of the region. Read mapping reduction in the gray repeat regions is due to an inability to map reads uniquely to those regions. (C) Twelve isolates from eight horses exhibited seven independent deletions of different regions of the has locus. Plots i–vii show read mapping of the has locus in example isolates for each of the deletions. Names to the right of the plots indicate isolates exhibiting the same deletion. Isolate names in bold are the examples used for the mapping plot. Read mapping drops to zero in the gray repeat regions due to an inability to map reads uniquely to this region. Deletion breakpoints, identified by finding breakpoints in reads, are indicated by vertical black lines joined by dashed bridges. Brackets indicate where one breakpoint location is uncertain due to falling in a repetitive region. The blue arrow in vii indicates the location of a novel IS insertion.

