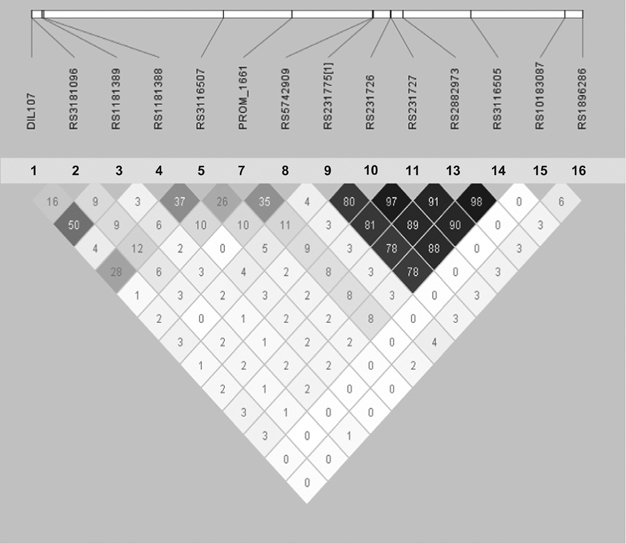
Figure 2.

Haploview plots of linkage disequilibrium (LD; r2) between the SNPs for the UK control cohort analysed in this study. The plot for the Norwegian controls looked very similar. Some of the SNPs for each control cohort were excluded due to low call rate and these were not included in the Figure. To clarify which SNPs that are included in the graph, the SNPs have also been relabelled 1–16, which corresponds to the numbers given in Figure 1.
