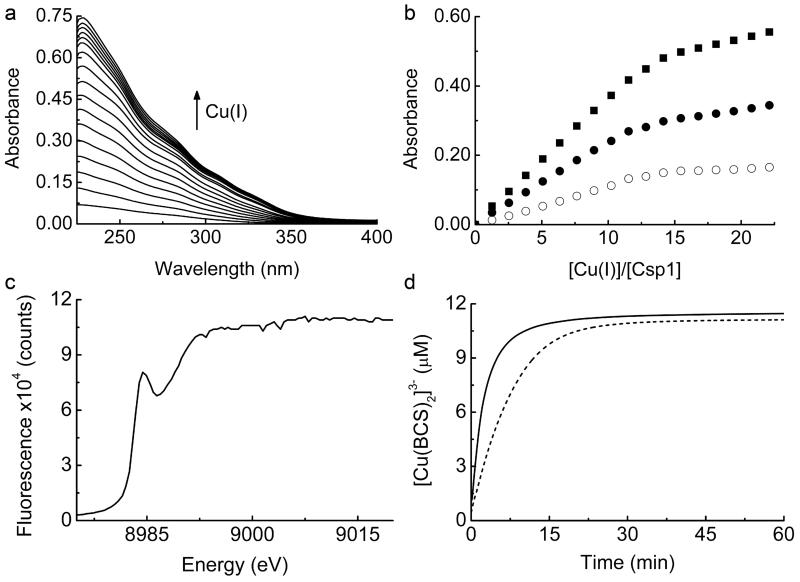
Extended Data Figure 2 . Cu(I) binding to Csp1.
a, UV-Vis difference spectra upon the addition of Cu(I) to apo-Csp1 (5.32 μM) showing the appearance of S(Cys)→Cu(I) LMCT bands10,23,24. b, Plots of absorbance at 250 (filled squares), 275 (filled circles), and 310 (open circles) nm against [Cu(I)]/[Csp1] ratio taken from the spectra in (a). The absorbance rises steeply until ~ 11-15 Cu(I) equivalents but continues to rise, particularly at lower wavelengths, making binding stoichiometry difficult to determine precisely with this approach. Systems that bind multiple Cu(I) ions in clusters such as those found in metallothioneins, typically give rise to luminescence at around 600 nm10,13. However, limited luminescence is observed at 600 nm during the titration of Cu(I) into Csp1 (data not shown). c, X-ray absorption near edge spectrum of a fresh crystal of Cu(I)-Csp1 at 100 K. d, Plots of [Cu(BCS)2]3− formation against time after the addition of Cu(I)-Csp1 (0.93 μM) loaded with 11.8 equivalents of Cu(I) to 2510 μM BCS either in the absence (dashed line) or presence (solid line) of 7.9 M Urea. Cu(I) is removed faster in urea and is limited by the rate of Cu(I)-Csp1 unfolding (Extended Data Fig. 5i). The presence of urea has little effect on the end point for this reaction. a, b and d were all performed in 20 mM Hepes pH 7.5 containing 200 mM NaCl.

