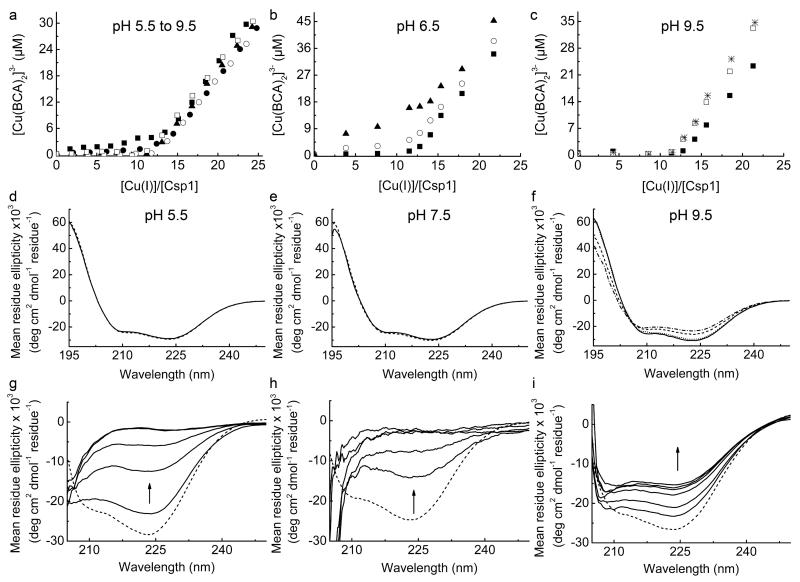
Extended Data Figure 5 . The dependence on pH of competition between Csp1 and BCA for Cu(I), and far-UV CD spectra showing pH stability and unfolding of Csp1 in urea.
a, Plots of [Cu(BCA)2]3− concentration against [Cu(I)]/[Csp1] ratio for the addition of Cu(I) to apo-Csp1 (2.38-2.56 μM) in the presence of 103 μM BCA in 20 mM buffer (see Methods) at pH 5.5 (filled squares), 6.5 (filled circles), 7.5 (filled triangles), 8.5 (open circles) and 9.5 (open squares) plus 200 mM NaCl. Equilibration is fast (< 20 min) at pH 6.5 and higher and the data shown are from titrations of Cu(I) into apo-Csp1. At pH 5.5 equilibration is slower and the data are for mixtures incubated for 21 h. Also shown are results for mixtures of Cu(I) with apo-Csp1 (3.31-3.67 μM) at pH 6.5 (b) and 9.5 (c) in the presence of 120 (filled squares), 300 (open circles), 450 (stars), 600 (filled triangles), and 900 (open squares) μM BCA, all after 15 h incubation. At lower BCA concentrations Csp1 is able to effectively compete for Cu(I) in the pH 6.5 to 9.5 range giving Cu(I) binding stoichiometries of 12-14 (see also Fig. 3a and Fig. 4a). At pH 5.5 Csp1 competes less effectively with BCA for Cu(I) most likely due to the protonation of Cys ligands37. This is consistent with greater competition by 600 μM BCA at pH 6.5 (b) compared to pH 7.5 (Fig. 4a). The stability of apo-Csp1 over the pH and time range used for experiments with BCA (and BCS) was determined using far-UV CD spectroscopy. The spectra of apo-Csp1 (solid lines) at pH (d) 5.5 (34.1 μM, 0.43 mg/mL), (e) 7.5 (36.5 μM, 0.46 mg/mL) and (f) 9.5 (32.6 μM, 0.41 mg/mL) are compared with those for samples incubated for 43 h (dashed lines), and also for 3 (dotted line) and 17 (dashed/dotted line) h at pH 9.5. At pH 9.5 and in the presence of higher BCA concentrations (c), Csp1 binds approximately one less equivalent of Cu(I) that must be due to changes in structure that are observed at this pH value (no change after 3 h but there is a decrease of ~ 15-20% α-helical content at longer incubation times, see f). However, the remaining sites bind Cu(I) more tightly (c) than at pH 7.5 (Fig. 4a) due to deprotonation of the Cys ligands37. g, Far-UV CD spectra of apo-Csp1 (19.9 μM, 0.25 mg/mL) in 20 mM Hepes pH 7.5 containing 200 mM NaCl at 0, 30, 60, 120, and 240 min (solid lines) after the addition of urea (7 M) compared to the spectrum for apo-Csp1 in the same buffer but with no urea (dashed line). h, Far-UV CD spectra of apo-Csp1 (7.94 μM, 0.10 mg/mL) as in (g) except that spectra were acquired at 0, 15, 30, 45 and 60 min (solid lines) after addition of urea (7 M); unfolding is significantly faster at lower protein concentrations and is consistent with the reaction with DTNB in urea being complete in 20 min at Csp1 concentrations < 4 μM. i, Far-UV CD spectra of Csp1 incubated with 14.0 equivalents of Cu(I) (19.9 μM, 0.25 mg/mL) as in (g) but at 0, 60, 240, 360, and 480 min and 24 h (solid lines) after addition of urea (7 M) compared to the spectrum for Cu(I)-Csp1 in buffer with no urea (dashed line). The arrow in g to i indicates how the spectrum changes with time.

