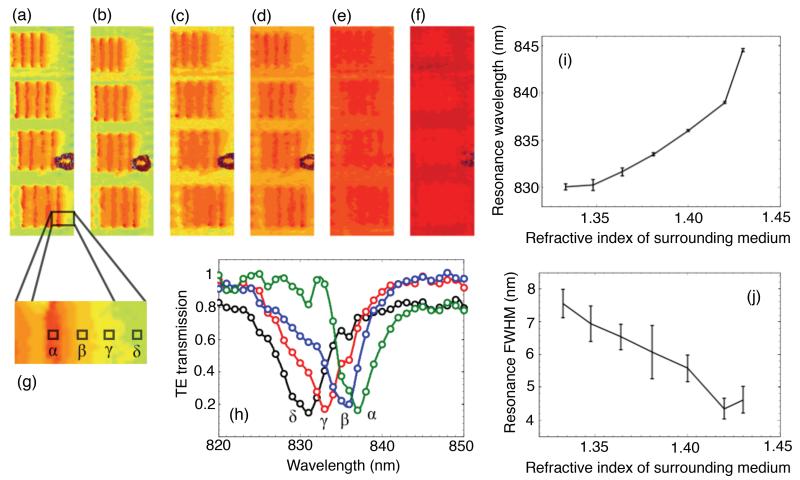
Fig. 5.
(a)–(f) Resonance images of resist blocks as refractive index contrast is lowered. Δn ≈ 0.077, 0.062, 0.046, 0.029, 0.010, and −0.010 in (a)–(f), respectively. (The negative value indicates that the index of the surrounding liquid is now greater than that of the resist.) The width and the spacing of the bars in each frame is 7 μm for the top group, increasing to 8.5 μm for the bottom group, and the bars are aligned parallel to the grating grooves. Resolution is thus measured perpendicular to the grating grooves, as in Fig. 2(b). (g) Zoomed-in region indicating locations of pixels for the spectra in (h). Average resonance wavelength (i) and FWHM (j) of background pixels vs. surrounding refractive index. Error bars show the standard deviations.

