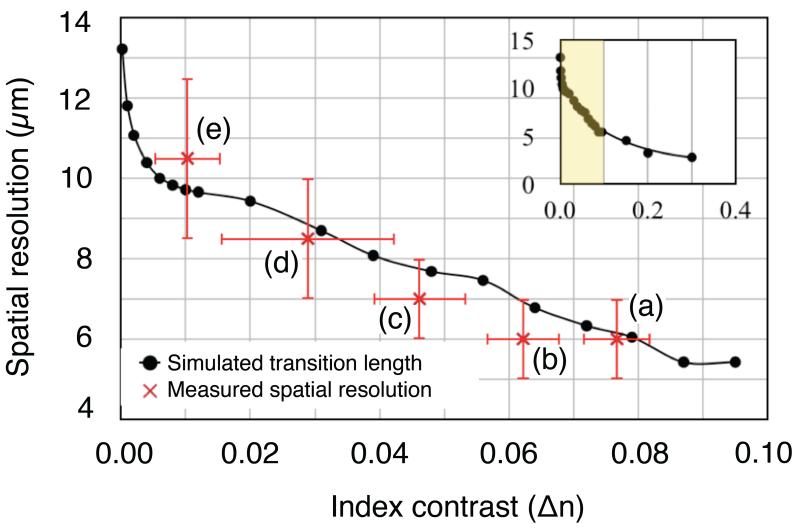
Fig. 6.
Plot of measured (red) and simulated (black) spatial resolution as a function of refractive index contrast. (Inset) Zoomed out plot of simulated spatial resolution up to higher Δn. The yellow shaded region indicates the area used for the main plot. Letters correspond to the images in Fig. 5(a)–(f).

