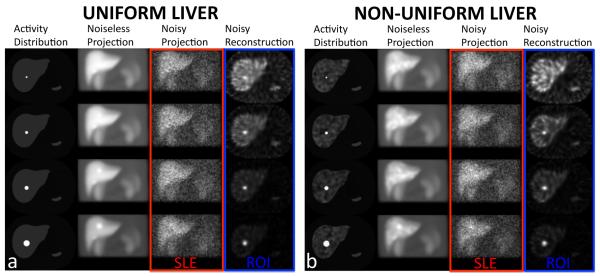
Figure 1.
Sample transverse slices of the activity distributions, noise free and noisy anterior projections (1 out of 120 total projections), and transverse reconstructions of the NCAT phantom. Spherical simulated tumors of 1, 1.5, 2 and 3 cm diameters (1st row – 4th row) for a contrast ratio (CR) of 5 inserted into (a) uniform liver and (b) non-uniform liver backgrounds, are shown. Note as indicated in the figure, the SLE and ROI methods operate on the raw projection and reconstruction data, respectively.

