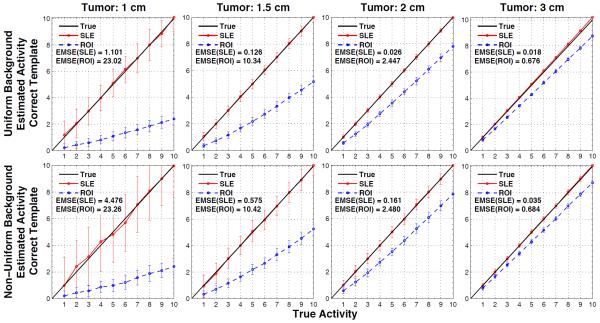
Figure 4.
Results for when the tumor size and location are known exactly, for tumors at location of figure 2b. Average SLE and ROI estimated activities are plotted relative to the true activities for the uniform liver (1st row) and non-uniform liver (2nd row) backgrounds. The error bar for each data point is the standard deviation over 100 noise realizations. As indicated by the ensemble mean-square errors (EMSE), SLE dramatically outperformed ROI for all these cases. Differences in the ROI slops between the figure 3 and 4 show how ROI estimation is biased by the tumor location.

