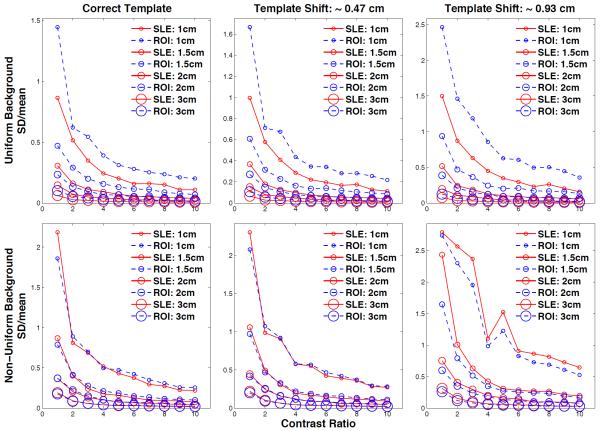
Figure 9.
SD(estimation)/mean(estimation) values plotted for the 10 contrast ratios (CR) and 4 tumor sizes for the uniform (1st row) and non-uniform liver (2nd row) backgrounds. The sizes of the data markers are proportional to the tumor sizes. For the ideal case (using the correct tumor model), the relative SLE variances are lower than that of ROI for all marker sizes and CR. When the modeled tumor location is shifted, relative SLE variances are lower and only slightly larger than that of ROI for the uniform and non-uniform liver, respectively.

