Figure 4.

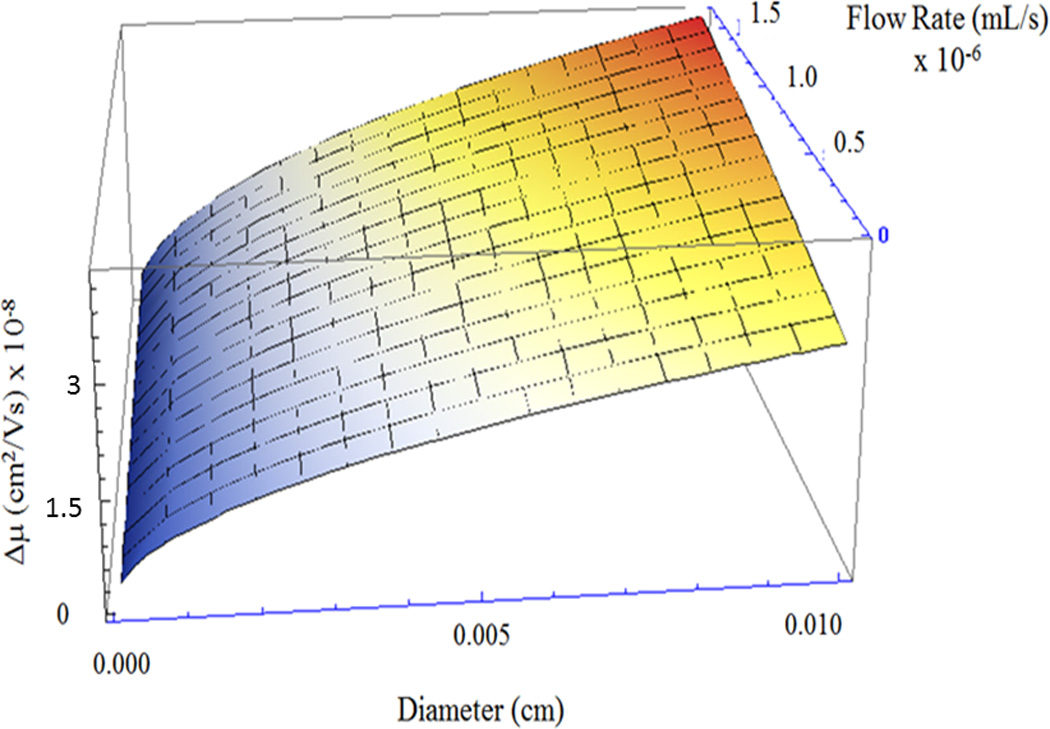
Resolution as a function of capillary diameter and flow rate. Resolution is described by Δμmin (vertical axis) and decreases most notably with smaller capillary diameters (left edge of graph).

Resolution as a function of capillary diameter and flow rate. Resolution is described by Δμmin (vertical axis) and decreases most notably with smaller capillary diameters (left edge of graph).