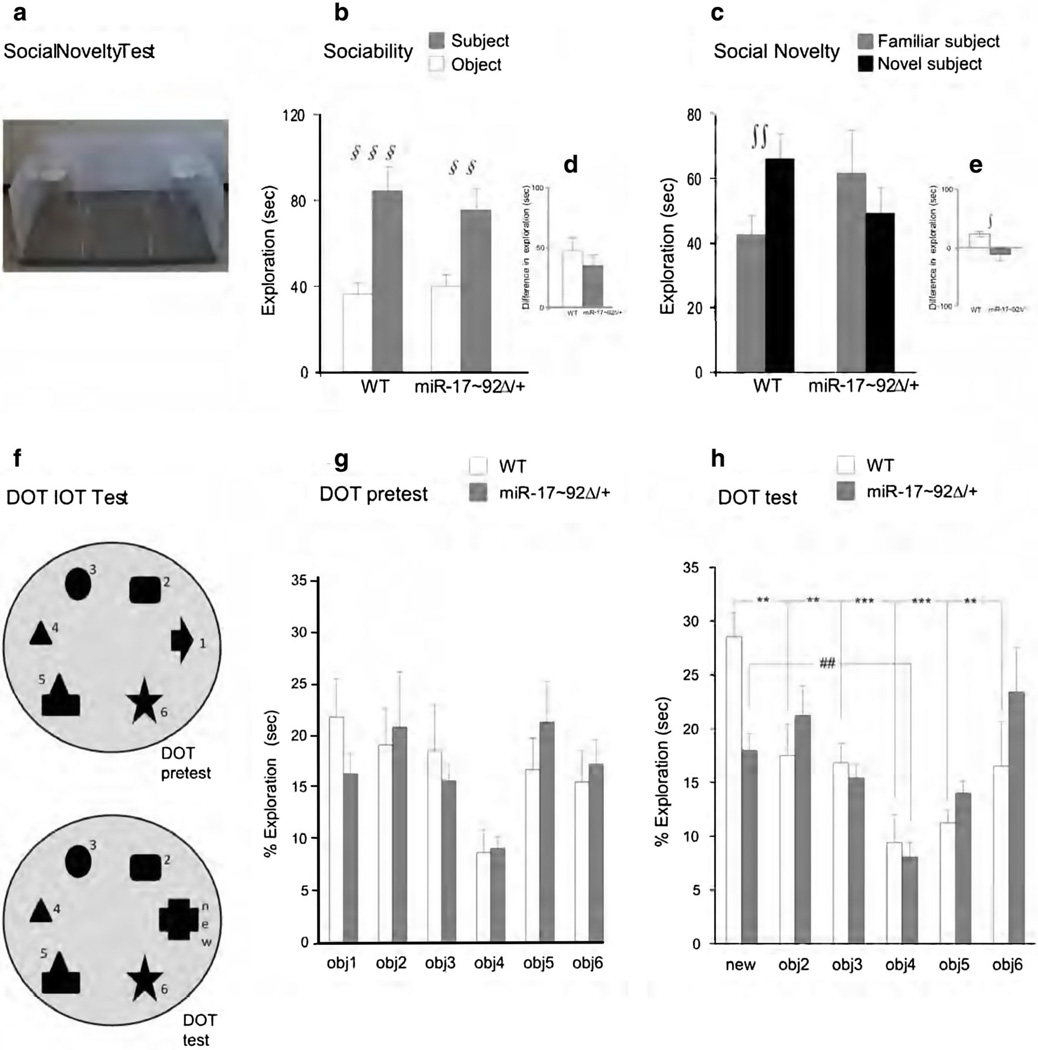
Fig. 3.
Adult behavioral assay. Social novelty test a Photograph of social novelty apparatus. Results are expressed as mean time spent sniffing object and subject (b) and as mean time sniffing the familiar subject and the new subject (c). In d, e data are presented as difference between the time spent sniffing the subject minus the time spent sniffing the object (d) or the novel subject minus the familiar subject (e). DOT IOT test f Representation of DOT-IOT apparatus. Results are expressed as mean percentage of time spent exploring the six objects (g) and the new objects versus the familiar ones (h). All data are expressed ad mean + SEM. §§,§§§ p < 0.01 and 0.001 for subject versus object. ++ p < 0.01 for familiar versus novel subject. **, *** p < 0.01 and 0.001 for new versus familiar object for WT. ## p < 0.01 for new versus familiar object for miR-17–92Δ/+

