
Figure 2.
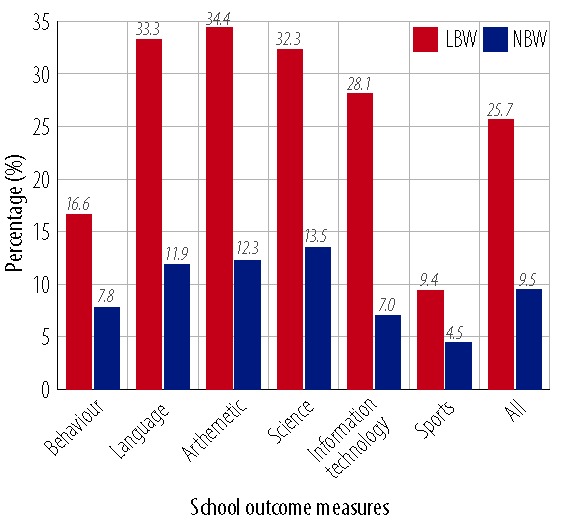
Percentage of low birth weight (LBW) and normal birth weight (NBW) children with below average performance in six domains of school outcomes.
Official websites use .gov
A
.gov website belongs to an official
government organization in the United States.
Secure .gov websites use HTTPS
A lock (
) or https:// means you've safely
connected to the .gov website. Share sensitive
information only on official, secure websites.
Percentage of low birth weight (LBW) and normal birth weight (NBW) children with below average performance in six domains of school outcomes.