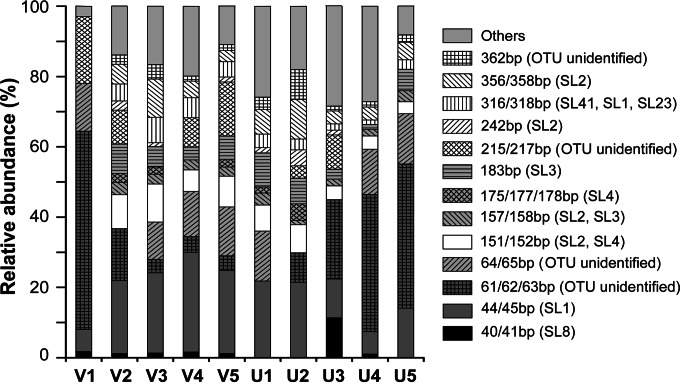
FIG 3.
Variation in the dominant T-RFs of nifH genes in all of the samples. A T-RF was considered dominant when the cumulative abundance of the T-RF was higher than 70% in each sample from the Swan Lake lagoon. The legend shows the lengths of the T-RFs and the corresponding amino acid OTUs from clone library analysis.

