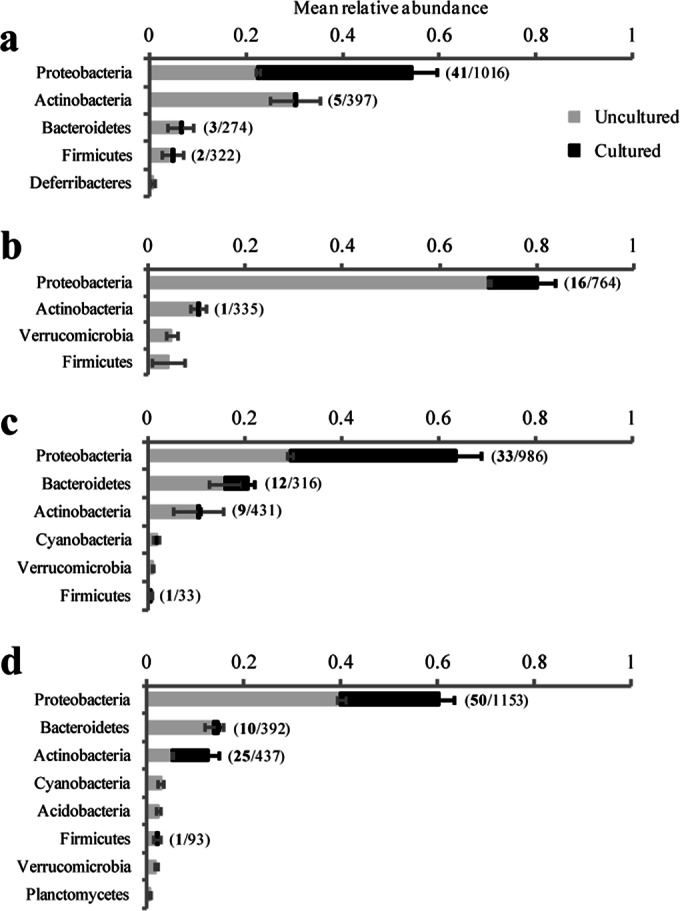
FIG 5.

Relative abundances of culture-independent bacterial phyla associated with bullfrogs (a), newts (b), spring peepers (c), and toads (d). The complete bar represents the total mean relative abundance of each phylum, while the black portion of the bar represents the cultured portion of each phylum. The numbers in parentheses show the number of “species-matched” cultured OTUs (in bold) out of the total number of OTUs in the phylum for each amphibian species. Only phyla with mean relative abundances of >0.5% for each species are shown. Error bars represent standard errors.
