
FIG 3.
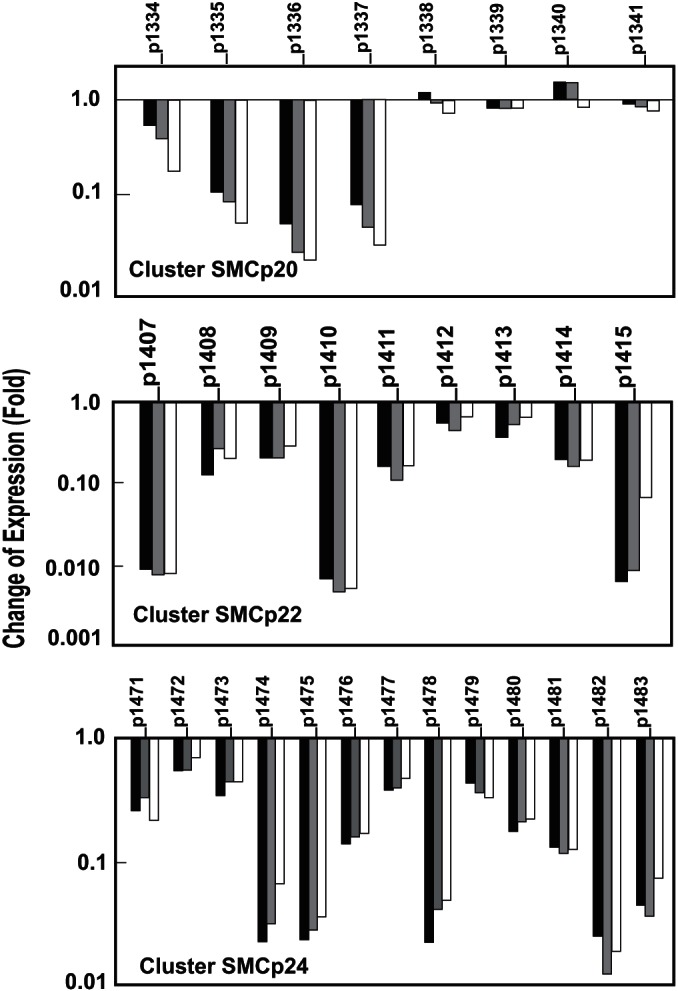
Effects of the lack of ClaR on the SMCp20, SMCp22, and SMCp24 gene cluster transcription. Transcriptomic results of genes of the SMCp20 cluster (top), the SMCp22 cluster (middle), and the SMCp24 cluster (bottom) in S. clavuligerus ΔclaR::aac compared to S. clavuligerus ATCC 27064. The columns represent the average of the fold change of expression at 22.5 h (black columns), 46.5 h (gray columns), and 60 h (white columns). The corresponding gene is indicated at the top of the columns. The values are compared to those of the control strain, S. clavuligerus ATCC 27064, taken as 1.