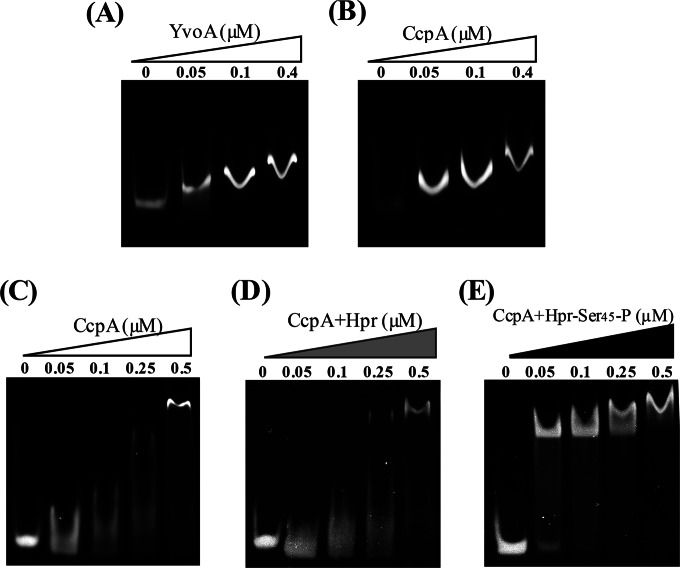
FIG 3.
EMSAs to detect binding of CcpABt and YvoABt to their targets. DNA fragments were detected by staining. (The concentrations of CcpABt and YvoABt are indicated in the labels above each panel.) (A) Analysis of YvoABt binding to PchiB (158 bp). A total of 0.05 μM PchiB was mixed with various concentrations of YvoABt. (B) Analysis of CcpABt binding to PchiB. A total of 0.05 μM PchiB was mixed with various concentrations of CcpABt. (C to E) Analysis of CcpABt binding to Pcre (40 bp). (C) A total of 0.1 μM Pcre was mixed with various concentrations of CcpABt. (D) A total of 0.1 μM was Pcre was mixed with various concentrations of CcpABt in the presence of 4 μM Hpr. (E) A total of 0.1 μM Pcre was mixed with various concentrations of CcpABt in the presence of 4 μM Hpr-Ser45-P.

